
MLB Reverse Line Movement: Identifying Sharp Money Market Signals
 Available in US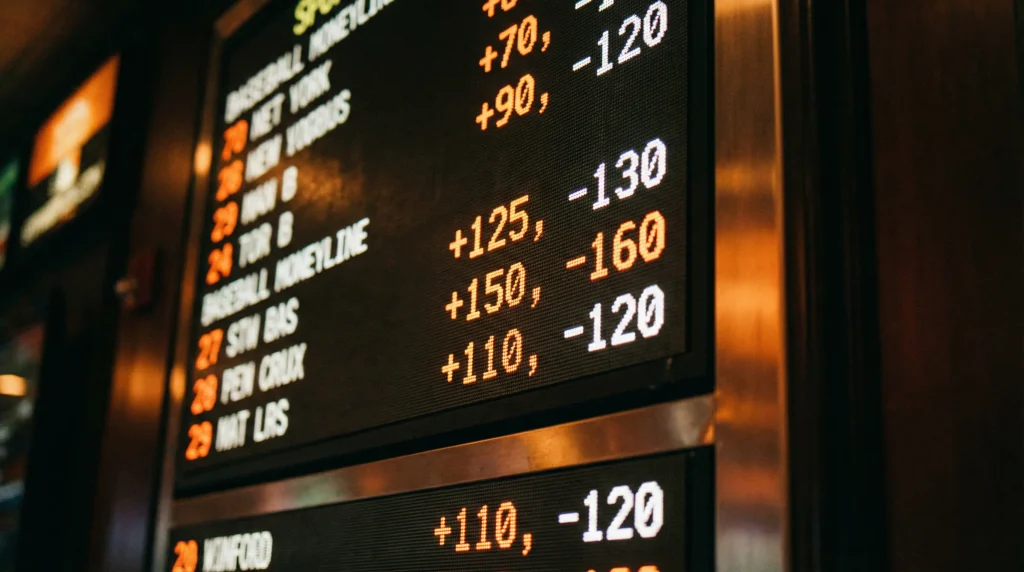
The first time I noticed reverse line movement on an MLB game, I nearly dismissed it as a data error. A team was receiving 72% of public bets, yet the line moved against them — the bookmaker made the less popular side cheaper, not more expensive. That contradiction stopped me cold. Why would a bookmaker move the line away from where the majority of tickets were landing? The answer reshaped how I read the market.
Reverse line movement is one of the most discussed concepts in sports betting, and one of the most misapplied. Used correctly, it is a genuine filter that reveals where large, informed money is landing. Used as a standalone system — “bet every RLM signal and count the profits” — it is a path to mediocre results dressed in sharp-money clothing. I want to show you both sides.
Identifying Sharp Money via Reverse Line Movement
Americans legally wagered $166.94 billion on sports in 2025, an 11% increase on the prior year. That staggering handle means lines at major sportsbooks are shaped by enormous volumes of money. When the line moves in the opposite direction from where public ticket count suggests it should, the implication is that a smaller number of larger, sharper bets on the other side are carrying more weight than the flood of public money.
Sportsbooks do not move lines based on ticket count alone. They move lines based on liability — the actual money they stand to lose. A hundred $20 public bets on Team A total $2,000. One $15,000 bet from a respected sharp account on Team B carries far more weight. If the sportsbook respects that account’s track record, they adjust the line toward Team B even though Team A has 85% of the tickets. That is reverse line movement in action.
What RLM does not tell you is why the sharp money landed where it did. The informed bettor might have a proprietary model, inside information on a pitcher’s health, or simply a different read on the matchup. You see the footprint — the line moved — but not the reasoning. Blindly following the footprint without understanding the potential reasoning is like copying someone’s exam answers without knowing if they studied. Sometimes they aced it. Sometimes they guessed.
RLM also has a shelf life. In a fast-moving market with 15 games per day, sharp money arrives early and the line adjusts. By the time a casual bettor spots the reverse movement on a tracking website, the value may already be gone. The line has moved precisely because the smart money got down, and now the price reflects the sharps’ position. You are buying at the adjusted price, not the original one.
Public Betting Splits: Where to Find Them and How to Read Them
The hold percentage across US sportsbooks rose from 8.1% in 2022 to 10.84% by early 2026. Part of that increase reflects bookmakers getting better at managing sharp action, which means public betting split data — the percentage of tickets and money on each side — has become simultaneously more accessible and more difficult to profit from.
Several free websites publish MLB public betting percentages. The numbers are approximations, drawn from a subset of sportsbooks rather than the entire market. That matters. If a site reports 70% of bets on Team A, the actual figure across all books might be 65% or 75%. Treat these numbers as directional indicators, not precise measurements. The signal is “heavy public lean” or “roughly even action,” not “exactly 71.3% of tickets.”
I read public splits in two steps. First, I identify games where one side has drawn more than 70% of public tickets. That threshold represents a strong public lean. Second, I check whether the line has moved toward or against that lean. If 75% of tickets are on Team A and the line has moved toward Team A (making them more expensive), the market is behaving normally — public money is driving the line. If the line has moved against Team A (making them cheaper), that is RLM. The combination of a heavy public lean plus a line move in the opposite direction is the classic RLM signal.
What I do not do is bet every RLM signal. The signal tells me something interesting is happening in the market, so I then investigate the matchup independently — the starting pitchers, bullpen states, lineup construction, any injury news. If my own analysis aligns with the direction the sharp money is pointing, the RLM signal serves as confirmation. If my analysis does not support the sharp side, I pass. RLM is an input, not a conclusion.
Steam Moves vs Organic Drift: Separating Signal From Noise
Andrew Rhodes, the chief executive of the UK Gambling Commission, noted that total gross gambling yield in the UK reached its highest ever level at £15.6 billion, with participation stable at 48% of the adult population. That scale of market activity creates its own noise, and the MLB betting market is no different. Not every line move is meaningful. Understanding the difference between a steam move and organic drift is critical for reading RLM accurately.
A steam move is a sudden, sharp line adjustment that happens within minutes and cascades across multiple sportsbooks. It is caused by a large bet or coordinated group of bets from accounts the book respects. Steam moves are the purest form of RLM — they represent concentrated sharp money arriving all at once. When you see a line jump from -130 to -145 on one side within a ten-minute window, and that same jump appears at three or four different books simultaneously, that is steam.
Organic drift is slower and less meaningful. A line that moves from -130 to -135 over three hours might just be natural market balancing. Recreational bettors are placing bets throughout the day, and the book adjusts incrementally to manage its exposure. There is no single sharp bet driving the move — it is the accumulated weight of public money gradually pushing the line. Organic drift in the direction of public money is the most common form of line movement and carries almost no predictive signal.
I focus exclusively on steam-style RLM for my own betting. The tools available to track these moves range from free line-tracking websites (which show movement after the fact with a delay) to paid services that alert you in real-time when lines shift rapidly at multiple books. The free tools are adequate for building intuition and studying patterns. If you want to actually bet the steam move before the value evaporates, you need speed — and that usually means a paid tracking service or a very disciplined routine of checking lines at specific intervals.
Using RLM as One Filter in a Multi-Factor Model
I place RLM alongside four other factors in my daily MLB handicapping: starting pitcher matchup, bullpen state, lineup quality, and ballpark/weather. RLM is useful as a tiebreaker. When my analysis of the matchup leaves me undecided between the two sides, an RLM signal can tip the balance. When my analysis strongly favours one side and RLM confirms it, my confidence increases. When my analysis points one way and RLM points the other, I usually reduce my stake or pass entirely.
What I never do is override a clear analytical read because of an RLM signal. Sharp money is sharp, but it is not infallible. Professional bettors lose roughly 45% of their bets — they are profitable because they bet at positive expected value, not because they are right every time. An RLM signal represents one sharp bettor’s opinion, and that opinion can be wrong. Treating RLM as gospel rather than as one data point in a larger framework is the most common mistake I see among bettors who discover this concept. A broader moneyline strategy built on matchup analysis will always serve you better than a system that merely follows line movements.
Prepared by the DiamondEdge editorial staff.
